Hi
Take a look at the SP5 patch list at:
http://www.utasker.com/forum/index.php?topic=40.0Point 4 may be what you need to solve the DMA problem(?)
Below is a guide to catching simple exceptions (all exceptions end up in the undefined interrupt routine where the cause can usually be identified quite easily by stopping with the debugger)
Regards
Mark
======================================================================
A common question concerns solving problems with an exception error which has occurred when developing code on the M5223X. All exceptions are handled as an undefined interrupt (see undef_int() in M5223x.c) and the code ends up in a forever loop until the watchdog triggers and restarts the board.
When developing, the watchdog is usually deactivated and so stopping the debugger reveals that the code is running around this forever loop – but how can we identify what has happened?
Fortunately the Coldfire core gives us some very good clues. Sometimes the reason is immediately obvious but sometimes we have to act like detectives and piece the clues together to get a final picture of what happened to lead to the processor ending up in this state.
Here is an example of how such problems can be analysed.
Example 1 – address error. This happens for example when a pointer is set to an invalid address (outside of register and memory space) and an access is attempted.
Consider the following ‘silly code’
  unsigned char *silly_pointer = (unsigned char *)0x12345678;
  *silly_pointer = 0x55;
Of course no one writes such silly code on purpose but we still sometimes do it (usually indirectly) so it is a good idea to be able to debug it on the target (note that such errors are often found faster when working with the uTasker simulator, but sometimes they only occur on the target).
When this code runs the processor stops working properly and, if the watchdog is active, will reset after a short period of time. When debugging we disable the watchdog and can take a look at what has happened.
The uTasker project uses a simple catch-all interrupt to handle all unexpected exceptions:
// default interrupt handler - and undefined interrupts will arrive here
//
static __interrupt__ void undef_int(void)
{
    while (1) {}                                                         // wait here and analyse with debugger....
}
and the processor will be stuck in the while loop waiting for us to analyse its state. So this is what we do.
1. We first look at the internal processor registers which look something like this (In CodeWarrior this is opened using the menu“View | Registers”):
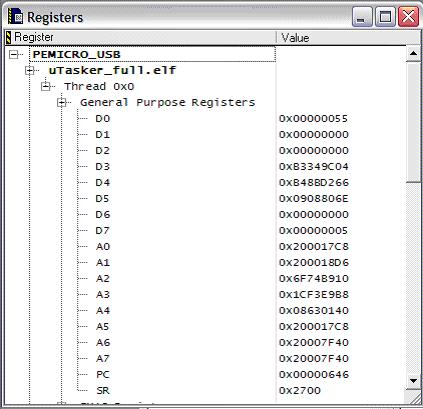
The Status Register is indicating 0x2700 where the 0x0700 mask indicates that all interrupts are masked (the exception masks them). The Program Counter is indicating the present code location (in the handing routine undef_int). The Stack Pointer (A7) is indicating the address 0x20007f40, which is in SRAM and is the most important piece of information there.
2. We open a memory window (displaying long words) to see what the stack content is. In CodeWarrior this is performed by clicking on the right mouse button and choosing “View Memory”.
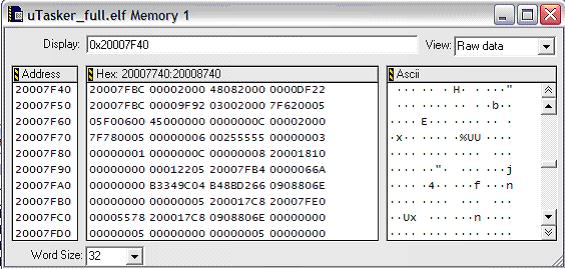
0x20007F40 is not of great interest to use, it is the result of the first instruction in the exception routine (link a6, #0) which copies the original content of a6 to the stack (it was 0x20007FBC) and then puts the stack pointer on entry to the routine in a6 before decrementing by 4. (a6 is usually used by sub-routines as a local stack pointer).
Also the following 0x00002000 is a consequence of the handler routine which has performed strldsr #0x2700 to mask all interrupts (saving the original SR on stack)
The next long word values are much more important:
0x48082000
0x0000df22
This is the exception stack consisting of useful information about the exception – the exception stack is detailed in the Coldfire Core documentation and an overview is to be found in the M5223X users’ manual in chapter 3.3.3.1.
The first long word can be interpreted as follows:
FORMAT mask = 0xf0000000 so the format is = 0x4
STATUS REGISTER mask = 0x0000ffff so the status register was 0x2000
VECTOR mask = 0x03fc0000 so the vector was 0x02 (from the Exception Vector Assignments table 3-5, this is “Access Error”.
FAULT STATUS mask = 0x0c030000 so the fault status was 0b1000 (this is a bit trickier because the bits are spread out and have to be grouped again) and from Fault Status Encodings table 3-7 this is interpreted as “Error on Operand Write”.
The next long word is the address that the PC was at when the fault occurred.
So this tells us that when the PC was ‘just before’ 0x0000df28 when it made an error on Operand write – it was neither from within an interrupt routine nor in a protected code region since the SR doesn’t show any interrupt mask bits set.
3. If you look at the call stack it ‘attempts’ to show the way that the processor got to this location:
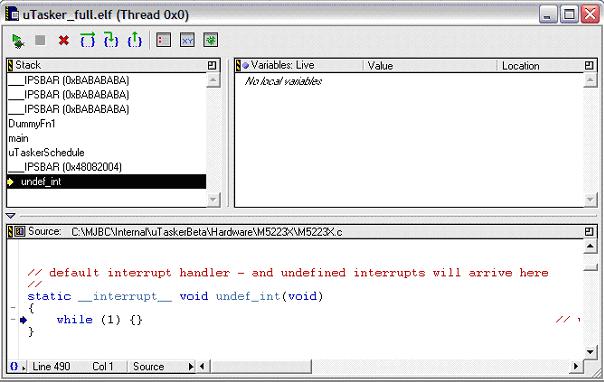
Sometimes it is very accurate but sometimes it can have problems with exceptions (especially when one exception results in another, which is a more tricky case…). Here is shows that the path was via main(), then uTaskerSchedule() but then is seems to have difficulties with the exact location of the offending instruction.
We do the following to get to the line of code:
Set the value of the PC to 0x0000df28 and display the code in mixed mode (source and assembler) – at the bottom of the editor window of the file it is in, you can choose between ‘source, assembler and mixed’.
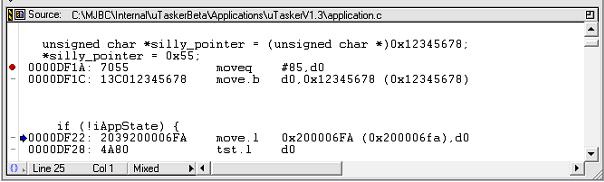
Now the offending line of code is clear.
0000DF1C: 13C012345678 move.b d0,0x12345678 (0x12345678)
This is the line which is trying to copy the content of d0 (0x00000055) to the invalid address 0x12345678.


